Kamis, 16 Juni 2016

Latest modern science | Search engines for technical graphics - Si Bejo Science

How important are academic graphics? A new pre-print in arXiv argues, �Pretty damn important.� This news summary of the technical article says:

(T)heir most remarkable discovery is that the most successful papers tend to have more figures. By plotting the number of diagrams in a paper against its impact, the team concludes that high impact ideas tend to be conveyed visually.

Lee and co say there are two possible explanations for this: �That visual information improves the clarity of the paper, leading to more citations, and higher impact, or that high impact papers naturally tend to include new, complex ideas that require visual explanation.�

The team has a search engine for scientific graphics called Viziometrics. My first pass, for �crayfish,� gave a mess on non-intuitive results (click to enlarge):


Things improved markedly when I selected only for diagrams and photos, however.


Speaking of searchable graphics databases, Atlas looks promising for some purposes. I tried searching for something that I thought must get plotted a lot in science, �Impact Factor�:


Nothing looked relevant to scientific publication, so I tried a couple of other topics familiar to me. I had success with �lobster�, because I reckoned there would be fisheries data. There was:


Things get good when you drill down to a single graph:


There�s a reference, so you know where the data came from. You can download the image created by Atlas, or download the data yourself in a plain text (CSV) file. Atlas is a product of the Quartz online news outlet. I�m not sure yet if it only includes data from Quartz stories.

These are not going to replace Google Images or Flickr any time soon, but they might be useful for some purposes.

Hat tip to Ananyo Bhattacharya for Viziometrics and to Knight Science Journalism for Atlas.

Kamis, 09 Juni 2016

Latest modern science | What is the �ePoster� format? - Si Bejo Science


I�ve been predicting that we�re going to see a slow decline in paper posters for a while, so I was interested when John Coupland and Lady Scientist drew my attention to the joint annual meeting of (deep breath)...

  • The American Society of Animal Science (ASAS)
  • The American Dairy Science Association� (ADSA�)
  • The Western Section of the American Society of Animal Science (WSASAS)
  • The Canadian Society of Animal Science (CSAS)

They are having presentations in an �ePoster� format. Their instructions are here. I can�t quite visualize this yet, but as near as I can tell, it is an illegitimate love child of a PowerPoint slide show and a paper poster.

It�s the size of a poster (about 40 inches wide)... but you can have multiple screens of information, with hyperlinks and videos (like slides). The conference FAQ says:

On average, presenters will normally have 3-�5 pages of content on their e-�posters.

How is this different from a slide show? The conference organizers are squelching the �Click to advance� button, and replacing them with timed animations and navigation buttons.

I am skeptical of this hybrid format. The single sheet of a paper poster enforces discipline. You have to make hard decisions about what to include or not include. I worry that allowing multiple slides will mean that people will upload their standard PowerPoint deck and just give their standard talk repeatedly instead of once. As far as I can tell, the �normally 3-5� comment notwithstanding, the only limit to the number of slides is the total size of the PowerPoint file.

On the other hand, presenters do have to upload the poster in advance, so you won�t see PowerPoint decks that were cobbled together on the plane trip on the way to the conference.

The conference provides two templates. Here�s a sample of one (with instructions intact):


And another, which I think is less effective:


I�m not a fan of these templates. For one, the blue background and text are fairly low-contrast. Because these are on a monitor, white text will be more effective than black: it will glow from the light behind it. The columns on the first seem rather wide. Displaying all the sections on the second seems rife for confusion.

And a conference logo. In prime real estate. I know what meeting I�m at, I�ve already paid the fee, there�s no need to advertise it any more.

Based on the conference documents, this is all being run by a company called ePosterboards, who are new to me. One of their services is they will provide design assistance to poster authors, for an unspecified fee. You have to contact them for a quote. This makes me super curious as to how much they are asking for.

Kamis, 02 Juni 2016

Latest modern science | Critique: Notorious DRG - Si Bejo Science

This week�s contribution is from Zach Sperry, who gave me permission to share his poster from the 2015 Neuroscience meeting. Click to enlarge!


Nobody should be embarrassed by a poster like this. The core design of this poster is solid. It�s a clean, three column layout that leaves no doubt as to how it should be read.

But... there is a lot going on in this poster. It might have benefited from the four tips on shortening posters I had just a few weeks ago.

Things I might do:

Take the university and lab logos in the title bar out. This would allow you to shorten the author and institutions credits from five lines to maybe two, and make the title bigger.

I cannot emphasize this enough: at big meetings, your title needs to be visible from the moon. Big meetings set poster boards far apart to have aisles for people to walk in. And Neuroscience in the biggest of the big. Do not skimp on space for your title!

As journalists say, this poster has buried the lede. The �Goal� statement is crystal clear, but it�s buried at the bottom of the first section, and the italics are not enough of a signal to show its importance. I like the clarity of the �Goal� statement so much that I might just hack that whole section down to that one sentence.

Try shrinking everything by 5-10% and increasing the white space between each individual element.

The text blocks are quite dense and dark. The typeface appears to be plain ol� Arial. I might try a thinner typeface and less bolding to make the text blocks look lighter.

There are quite a lot of bright colours on the poster, with red, green, orange, and blue all making appearances. While the area they cover is small, which generally favours those more intense colours, there are still a lot of them, which contributes to the feeling of business. They make sense in the graphs on the right, but the intense red for labels in the central bottom figure, or to make outlines in the right figure (�Cell bodies (blue pixels) transformed...�) might be a little too much.

Like the introduction, I would like the conclusion to be much tighter. The first of those three paragraphs alone might be enough. It tells you the two key take-home messages:

  1. The recording worked.
  2. We got new information from this recording.

Kamis, 26 Mei 2016

Latest modern science | Link roundup for May 2016 - Si Bejo Science

Matthew wins for best poster design cartoon this month:


You can see more of his cartoons at Errant Science. His inspiration for this one?

Just looked at a draft of a poster, there was text in size 2 point�

Just to drive the point home, let me say: Writing text in a 2 point font on a poster is dumb. Do not do that.

James Hamblin, writing for The Atlantic, has a fascinating article about using colour to increase the readbility of text. Here�s an example, where colour is used as a cue to tell you what the next line is:


This specific example is from a company called BeeLine. They have plugins for Chrome for the web and PDFs. Here�s this blog viewed in Beeline:


I haven�t had success with reading my PDF reprints in BeeLine colour yet.

The Atlantic article suggests there are many more possibilities to improve the reading experience beyond what we have learned from the printed page. I would not recommend trying it for a poster quite yet, because the unfamiliarity might be confusing or annoying for readers. A browser plugin is not like a poster: the reader has the control in the former, but not the latter.

The Atlantic article also mentions the Microsoft typeface Sitka (sample at right):

(Microsoft researcher Kevin Larson�s) team also recently launched a new font that was designed for the best possible readability. Called Sitka, it went through a multistep, iterative design-test process. Each letter was changed and adjusted to maximize ease of reading � as opposed to most other fonts, which are made to mimic typefaces that existed in print media. �Times New Roman was designed to work very well with the technology of the era,� Laston explained. (I asked him if he has, then, created the most legible font in history. He said he �wouldn�t go that far.�)


I might just try Sitka on my next poster.

I really enjoyed this blog post by Stephen Few about 3-D graphs. You know, like this one:


Not only is the article thoughtful, there are some great one-liners:

(P)oking holes in Edward Tufte�s work in particular now qualifies as a competitive sport.

And I like the conclusion:

It is important to realize that what is often claimed by infovis researchers is just plain wrong, due to bad science. I wholeheartedly agree... that we should not accept any data visualization principles or practices as gospel without confirming them empirically. However, we should not throw them out in the meantime if they make sense and work, and we certainly shouldn�t reject them based on flawed research.

Today in �Colour is a subtle thing,� Ed Hawkins looks at how �rainbow� coding for maps led to some incorrect interpretations.


Hat tip to Rob Simmon.

I�ve followed the fate of �dynamic posters� at the Neuroscience meeting since they were first announced. I think a fee to have one is new:

$150 fee to present a Dynamic Poster #SFN16? pass. - Drugmonkey

And the question remains how many people are genuinely using the format to its fullest:

80% of those are just people who wanted to give a talk. Rarely actually need video. - Dr. Becca

Michael Hoffman is looking for new graphics software:

Wish I had something that made it as easy to make diagrams as PowerPoint but still publication quality like Illustrator.

In the replies to this tweet, people bring up xfig, Sketch, Drawio, Omnigraffle, Canvas, Graphic, and Pages.

QUote of the moment:

�Typography is frozen sound.��Ran Zheng

Hat tip to Ellen Lupton.

Another university, another new logo freak-out.


Kamis, 19 Mei 2016

Latest modern science | The problem with point size - Si Bejo Science

�What�s the smallest point size you can put on a poster?�

This is a common question, but it�s not one that has a simple answer.

I know many scientists read this blog, and scientists work in a world where measurements are universal. 37�C is 37�C no matter wherever you are, whatever you�re measuring, and are exactly comparable. Someone from a scientific background probably thinks that two identical pieces of text � in different fonts but the same point size � should take up the same space.

I have bad news. Point size does not work like that.


These two paragraphs are both set in serif typefaces, both nominally 16 points in size, but one takes 19% more column length than the other. This difference can arise because individual letters in the two fonts might have the same height, but different widths. The letter O may be a wider circle, or a narrower oval, for example.

That 19% will make a big difference in your layout, even if the two blocks of text are similarly readable.

I have selected two fonts with a fairly large difference here. Many other standard fonts will probably be more similar in their use of space. But it points out that you can�t rely on font size alone to guide your poster design.

Instead of blindly following a minimum font size, work from a couple of guiding principles.

  1. The bigger the text, the better.
  2. Test, test, and test some more. Print full sized sample paragraphs at the point size you want to use (12 point 18 point, 24 point, 30 point), tack them to a wall, and stand back a couple of meters and see how they look.

But if all thoughtful design and testing stuff bores you, the answer is:

Nothing smaller than 24 point on your poster.

There. Happy?

Kamis, 12 Mei 2016

Latest modern science | Four simple tips for shortening your poster - Si Bejo Science


Few things will turn away a potential poster viewer like long paragraphs of text. So one of the recommendations I (and many others) make for posters is to write less stuff. But it is not easy.

There�s a saying (wrongly attributed to Abraham Lincoln), that if you have a short time to cut down a tree, spend most of it sharpening the axe. Here are some ways to sharpen your editorial axe.

1. Walk away.

When you�re in the middle of a project that you designed and carried out, everything seems important. But time away from something helps bring clarity. Think about a favourite album or TV series that you haven�t watched in years. You won�t remember all of it; you will remember the highlights.

You can get clarity by not working on a poster for a few days, then coming back at it with fresh eyes.

I think this is be the surest and best approach, the problem is that it takes time. You have to start early, and allot �cool down time� of a few days where you do not look at the poster. Given how many academics don�t want to give posters because they want to slap together a PowerPoint talk on the plane on their way to a conference, getting them to work on posters well in advance is a tall order.

2. Show it to someone else.

An outside viewer doesn�t have that emotional or intellectual investment in a project that you have. The further away you can get, the better. Show your poster to someone who isn�t in your lab. SHow it to a non-expert. Show it to someone with a different skillset.

Just remember that an outside observer is not necessarily an unbiased one. Everyone has their own tastes and preferences and styles. An outside observer may not be objective, but they will at least have different biases than you.

3. ABT.

�ABT� is short for �And... But... Therefore.� You take two facts (joined by �and�), followed by the complication (�but�), and a resolution (�therefore�).
 
It is one of the single most effective tools I have found for drilling down to a key point. And it has the advantage of being quick (unlike #1) and not needing others (unlike #2).

I�ve done this with many poster presenters. When I ask them to talk about what there poster is about, it often takes a few minutes. I don�t think many of them believe me when I say they should be able to summarize their poster in a sentence. Then I do it using the ABT format. And I can usually see the expression on their faces indicating I�ve hit very close to the mark.

I wouldn�t recommend condensing the entire poster to one sentence, but it�s great at chopping a couple of lengthy introductory paragraphs into one crisp sentence.

Randy Olson first introduced this sentence structure in Connection: Hollywood Storytelling Meets Critical Thinking (which I reviewed here), and has continued working with this tool in Houston, We Have a Narrative.

Additional: Randy notes that you can learn more about ABT in Story Circle Training here. He also advises for the verbal presentation that goes along with the poster:

1) Say your ABT, 2) Ask what person studies, 3) Find bridge between the two (from Samantha Roy)

4. Practice ruthlessness in all your writing. 

The Elements of Style by Strunk and White is not a perfect book on writing. Likewise, the fretting about Marxism in George Orwell�s essay, �Politics and the English Language,� is very out-of-date. But both remain worth reading because of their emphasis on being concise.

There are many lists that alert you to lengthy stock phrases that can be replaced with shorter words. Once you attune yourself to stock phrases (�At this point in time,� �The fact that�), it becomes easier to recognize them, cut them out, and replace them without losing any meaning (�Now,� �That�).

External links

To Cut Down a Tree in Five Minutes Spend Three Minutes Sharpening Your Axe
Connection: Hollywood Storytelling Meets Critical Thinking review

Kamis, 05 Mei 2016

Latest modern science | The inverse colour intensity rule - Si Bejo Science

Colour on a poster is powerful, but can be difficult to use well. One of the problems I often see is that people create posters with deep, bright, saturated colours that cover large areas:


It�s hard to get the full effect of this on a small computer screen, but those bright colours on a poster that several feet wide can be like a punch in the eyes. Size signals importance. So do bright colours. The combination of both can be overwhelming and is rarely necessary.

The larger the surface area you colour, the less you have to do for it to �read� as a distinct colour. You can go to a very light, almost pastel shade, and it will still come across as clearly distinct from a background or other colours. People can readily tell that you�ve highlighted something in blue.


If you have something that is very small like a select point of data on a graph, or something for emphasis � that�s the place where you can use those bright, intense colours to draw attention. Subtlety won�t cut it if something is small:


Bright colours can draw attention to something that isn�t dominating by virtue of space.


And the moral of the story is: The bigger the space you colour, the less intense the colour should be. I�m still not sure what the name of this principle should be, but �Inverse colour intensity� will do for now.

(The text? Happy Revenge of the Fifth, everyone!)

Kamis, 28 April 2016

Latest modern science | Link roundup for April 2016 - Si Bejo Science

Lisa Rost has a nice overview of colour tools to help with data visualizations. Some have appeared on the blog before, but this is a great summary.


MarkMaker bills itself as an automated logo designer (backstory here). It�s fun to look at, but I was unimpressed with the first suggestions:


I stayed with it, trying a few favourites and deleting ones I didn�t like. I was still baffled by this suggestion after a few rounds:


I suppose it might have a certain utility in getting you out of ruts, but I�m not convinced it has much more utility than randomly picking fonts in your graphics editor. Hat tip to Doctor Becca.

DrugMonkey reports from the floor of the joint American Society of Pharmacology and Experimental Therapeutics Experimental Biology meeting:

Saw a poster with Supplemental Materials today at #aspet #expbio #eb2016 � this is where we are people.

I... wait... what? As Clay Clark asked:

On back side of the poster?

Let me make this clear:

That�s dumb. Do not do that.

We hear about viral images on the internet, but most don�t look this amazing. Even if they didn�t move, they would still be stunning scientific visualizations.

Kamis, 21 April 2016

Latest modern science | Been there, done that... but couldn�t get the T-shirt - Si Bejo Science

Cathy Newman pointed out that this year�s Evolution meeting in Austin has conference T-shirts... but none in women�s styles.

Sigh.

Weirdly, this is a choice you have a pre-registration, months out from the conference, so it�s not as though you would make unneeded T-shirts.

In a little Twitter poll I ran, most people reported that if a conference had T-shirts, there usually weren�t women�s tees available.

Double sigh.

Come on, conference organizers. This sort of thing matters. I can�t do better than this post from Kathy Sierra:

The point is showing us that you care about more than just saving a few bucks on a t-shirt print run. That you care about ALL your users, not just the Big Burly Men.

This is partly tongue-in-cheek, but still... the t-shirts are a metaphor for � or at least a reflection of � the way the company feels about users as individual people. The shirts matter, and they speak volumes about your company.

External links

Tech t-shirts aren't sexy enough

Latest modern science | Critique: Red ware - Si Bejo Science

This week�s contribution comes from Scott Van Keuren. This poster recently graced the halls of the Society for American Archaeology meeting.Click to enlarge!


This a poster that has the right ideas, but doesn�t go far enough.

The title is excellent. It�s big, clean, and clear. I appreciate that this carries through the author listings, which are simpler than many posters. The logos are sensibly placed, unobtrusively, in the fine print section of the poster.

There are excellent photographs of physical objects, particularly in that critical left hand side. I would have like to have seen fewer, bigger pictures, even if that meant reducing the size of maps somewhat.

The headings also show consideration for the reader. Instead of the standard �IMRAD� headings,we mostly get questions that make it extremely clear which section of the poster is. If anything, I would like to see them bigger and more prominent. And that�s particularly valuable, because the rest of the poster sometimes leads you on a merry chase.

In the picture below, the red lines traces the order sections are meant to be read in, as I understand them:


The first column is very simple, but things take turns for the worse in the next two sections. Wrapping the scatter plots around the �What are results?� section particularly disturbs the reading flow; you have to jump a graph to get to the text, then back up to look at the scatter plots. In fact, the more I look at the poster, the less sure I am that the intended order is what I put above.

While the headings are so useful in guiding the reader, the amount I would have to read to get an answer to each question is a little intimidating. Even though I realize intellectually that the writing is not that much if it was an article, my eyes would glaze over in a poster hall.

Cutting is hard. You need to be ruthless, and you need to practice. But being concise is almost always the right way to go.

Kamis, 14 April 2016

Latest modern science | Critique and makeover: Gene sequence toolkit - Si Bejo Science

This week�s poster is from Kasey Pham, and is used with permission. Click to enlarge!


Kasey writes:

I�m a student having a little trouble with my first poster presentation. I�d like to cut down the text more so that there's more white space, but I'm already having trouble keeping the story coherent.

It�s certainly nowhere near the worst I�ve seen in terms of amount of text. It seems that the main areas to edit are the introduction and the conclusion. My crack at condensing the intro was to use Randy Olson�s �And But Therefore� template:

�Every individual of a species should share a common ancestor, and this can be tested using public data, but those data are sparse, therefore we created a tool.�

I think I�m closing in on shrinking your four paragraphs down to once sentence. But I don�t know what �sparse� data means in this context, therefore I�m not sure what problem the toolkit solves.

Cutting the conclusions are more important than the intro, because that could give space around the references and acknowledgements, which currently look crowded. I wanted hack down the conclusions from five bullet points to... um... fewer. One paragraph is a challenge, but a worthwhile one.

Editing is always a bear, and the only real way to do it is with practice and constantly reminding yourself to be ruthless.

In other areas...

I�m a fan of consistent reading order, so I don�t like how the middle section switches from the reading down that you see in the left columns (the introduction flows down to methods), to reading across in the middle (Figure 1 flows across to Figure 2, then carriage returns to Figure 3, etc.). That said, the use of a horizontal line between Figures (1 + 2) and (3 + 4) is enough of a cue to prevent the reader from getting too lost.

In the Methods, it looks odd to have only the top box (�Raw XML data�) narrower than all the rest. It would also be nice for the left edge of the flowchart to align with the left edge of the text above.

Here�s a quick and dirty revision that addresses a few of these comments:


Kamis, 07 April 2016

Latest modern science | The poster to publication puzzle (With stats and graphs and everything!) - Si Bejo Science

How many conference posters turn into published papers?

It�s not a trivial question. A huge amount of scientific information is presented at conferences. Scientific conferences should be the places to find the �coming thing.�

But in most research fields, the importance of conference presentations pale in significance to final papers, published in peer-reviewed journals. (My understanding is that conference proceedings take on more weight engineering and computing.)

How much material from conferences is lost is relevant to discussions about the speed and efficiency of scientific communication, replication crises, file drawer problems, p hacking, and the permanence of the scientific record. It raises issues of how much you can trust what you see at conferences, and how soon you might be able to cite work that you have seen at a conference.

There is an emerging literature on this. There are nine journal articles on the topic in the last two years alone.

Because this is the poster blog, I�m most interested in how many posters eventually turn into papers. So far, I�ve found eight papers that estimated how many posters and oral talks were eventually published. Because I�m a nerd scientist, I compared the probability that posters and papers will be published. I even did stats and graphs, damn it.

Posters have a significantly lower probability of being published than talks (t7 = -7.0, p = 0.00021). Posters have about a one in five chance of being published (21.2%), while talks have about a one in three chance of being published (34.4%).


Figure 1. Square = mean, horizontal line = median; box = 50% of data; whiskers = minumum and maximum; dots = individual papers (Bakkum & Trachimowicz 2015; Daruwalla et al., 2015; Durinka et al. 2015; Janssen et al., in press; Kinsella et al. 2015; Richling et al. 2014; Singh et al. 2015; Walsh et al. 2013).

The graph doesn�t quite give a real sense of the strength of the difference between posters and talks. Every one of the eight studies found that oral presentations were more likely to be published than posters at the same meeting. Here�s one that might show that a bit better:


Figure 2. Each line represents a single paper (same papers as Figure 1).

There are several hypotheses for why this difference exists, and they are not mutually exclusive.

  • Posters may be more likely to be given by students, who might not stay in research careers. If they leave, nobody picks up writing up the project.
  • Posters are more likely to be given early in a project, which means they are more likely to �blow up on the launchpad� or never be completed. Daruwalla and colleagues (2015) found no difference in the publication delay of posters and talks, however, which speaks against this hypothesis.
  • The authors of the posters may self-select their work, presenting what they consider to be weaker or less interesting projects as posters and saving their �A game� for talks. Evidence from Sawatsky and colleagues (2015) supports this: they found that posters had a lower average rating of scientific quality than talks. (This might also explain why most people prefer talks over posters: experience has shown them talks are better.)

Another five papers calculated how likely an abstract was to become a publication, but did not separate posters and oral presentations. The average there was about the same as calculated for talks (37.7%), with ranging anywhere from 18.8% to 73.5%. The latter, for a veterinary conference, is an outlier; no other conference cracked 50%.

A few papers calculated or presented data on the time between the conference presentation and the final appearance of the publication. The delay is usually around the two year mark.

This conference presentation conversion rate might be a measure that researchers can use to convince tenure and promotion committees that they are likely to be productive in the future. If more than a third of your posters have been turned into papers in a certain time frame, you are definitely ahead of the game.

There doesn�t seem to be any hints of a relationship between the field of research or the size of the conference in whether a presentation becomes a paper. That said, a couple of papers did use the opportunity to claim that higher conversion rates were indicative of the �high quality� of particular conferences (Durawalla et al. 2015; Kinsella et al. 2015).

Of course, once I had a benchmark, I had to know if I was beating it.

I opened my CV and counted 36 conference posters in my academic career (excluding local meetings on my own campus). So far, 32 of those have been turned into publications, a very satisfying 88% conversion rate.

But... this is a little misleading. Most of the studies had a time limit on getting those abstracts published. It was usually something like four or five years. If I knocked out papers that were five years or more between poster and publication (seven of them), my conversion rate drops to 69.4%. Which is... still not bad, actually. (But that one eight year delay between poster and paper... ugh.)

The ratio of posters to papers is nowhere near one to one, though. Sometimes projects made it onto multiple posters before being published as a single paper. One project got presented as a poster seven times before I was able to seal the deal and publish the project in a journal. My 32 poster presentations yielded 17 publications.

The reverse is true, too: there are some papers that I never presented at conferences, either as a talk or poster.

This topic seems to be an unexpectedly rich vein of meta-science. I would love to see an analysis from one of the mega-conferences, like the Neuroscience or American Geophysical Union meetings.

Extra special thanks!

This week�s post would have been impossible without the generosity of the awesome Biochem Belle! She first mentioned the poster to paper puzzle on Twitter. Then she saved me a bucket of work by creating a Google document with links to the papers below. Belle:


Additional, 9 April 2016: I ran a poll on Twitter asking people how many of their posters eventually turned into talks. I got 6o votes, which is not a bad sample size. Here are the results:


I am a little surprised by these results. These results are not exactly in line with the published results I summarize in the main part of the post. Maybe it reflects that scientists on Twitter are a more awesome subset of conference goers.

Update, 31 May 2016: I found a new paper which documents the lowest conversion from conference presentation to publication I have found yet. Disappointingly, it�s at a conference for medical publication professionals. Just 2.26% of posters turned into papers (3/133), and just 3.26% of talks became papers (1/31). Biochem Belle is also keeping track, and found another paper I missed. I have updated my box plot and t-test results accordingly:


Related posts

Variations on a theme: crayfish nociception

References

Bakkum BW, Trachimowicz R. 2015. Publication rates of abstracts presented at the 2006 meeting of the American Academy of Optometry. Optometry and Vision Science 92(11): 1069-1075. http://dx.doi.org/10.1097/OPX.0000000000000712

Carey LC, Stretton S, Kenreigh CA, Wagner LT, Woolley KL. 2016. High nonpublication rate from publication professionals hinders evidence-based publication practices. PeerJ 4: e2011. https://doi.org/10.7717/peerj.2011

Chand V, Rosenfeldt FL, Pepe S. 2008. The publication rate and impact of abstracts presented at the Cardiac Society of Australia and New Zealand (1999�2005). Heart, Lung and Circulation 17(5): 375-379. http://dx.doi.org/10.1016/j.hlc.2008.02.005

Daruwalla ZJ, Huq SS, Wong KL, Nee PY, Murphy DP. 2015. �Publish or perish��presentations at annual national orthopaedic meetings and their correlation with subsequent publication. Journal of Orthopaedic Surgery and Research 10(1): 1-8. http://dx.doi.org/10.1186/s13018-015-0203-y

Durinka JB, Chang P-N, Ortiz J. 2014. Fate of abstracts presented at the 2009 American Transplant Congress. Journal of Surgical Education 71(5): 674-679. http://dx.doi.org/10.1016/j.jsurg.2014.02.002

Dyson DH, Sparling SC. 2016. Delay in final publication following abstract presentation: American College of Veterinary Anesthesiologists Annual Meeting. Journal of Veterinary Medical Education 43(1): in press. http://dx.doi.org/10.3138/jvme.33.1.145

Fosb�l EL, Fosb�l PL, Harrington RA, Eapen ZJ, Peterson ED. 2012. Conversion of cardiovascular conference abstracts to publications. Circulation 126(24): 2819-2825. http://circ.ahajournals.org/content/126/24/2819.abstract

Janssen T, Bartels R, Lind B, Villas Tome C, Vleggeert-Lankamp CLA. Publication rate of paper and podium presentations from the European Section of the Cervical Spine Research Society Annual Meeting. European Spine Journal: in press. http://dx.doi.org/10.1007/s00586-016-4404-9

Kalkan A, Kose O, Bilir O, Ersunan G, Ozel D, Guler F. 2015. Publication rate of abstracts presented at the emergency medicine congresses held by the European Society for Emergency Medicine (EUSEM) in 2011 and 2012. Emergency Medicine Journal 32: 728-732 http://dx.doi.org/10.1136/emermed-2014-204063

Kinsella SD, Menge TJ, Anderson AF, Spindler KP. 2015. Publication rates of podium versus poster presentations at the American Orthopaedic Society for Sports Medicine Meetings: 2006-2010. The American Journal of Sports Medicine 43(5): 1255-1259. http://dx.doi.org/10.1177/0363546515573939

Richling SM, Rapp JT, Funk JA, D�Agostini J, Garrido N, Moreno V. 2014. Low publication rate of 2005 conference presentations: Implications for practitioners serving individuals with autism and intellectual disabilities. Research in Developmental Disabilities 35(11): 2744-2750. http://dx.doi.org/10.1016/j.ridd.2014.07.023

Rosmarakis ES, Soteriades ES, Vergidis PI, Kasiakou SK, Falagas ME. 2005. From conference abstract to full paper: differences between data presented in conferences and journals. The FASEB Journal 19(7): 673-680. http://dx.doi.org/10.1096/fj.04-3140lfe

Sawatsky AP, Beckman TJ, Edakkanambeth Varayil J, Mandrekar JN, Reed DA, Wang AT. 2015. Association between study quality and publication rates of medical education abstracts presented at the Society of General Internal Medicine Annual Meeting. Journal of General Internal Medicine 30(8): 1172-1177. http://dx.doi.org/10.1007/s11606-015-3269-7

Singh A, Solanki P, Mishra D. 2014. Publication rate of scientific papers presented at the XXVI Annual Convention of National Neonatology Forum (NEOCON 2006). The Indian Journal of Pediatrics 82(1): 25-28. http://dx.doi.org/10.1007/s12098-014-1475-7

Walsh CM, Fung M, Ginsburg S. 2013. Publication of results of abstracts presented at medical education conferences. JAMA 310(21): 2307-2309. http://dx.doi.org/10.1001/jama.2013.281671

Kamis, 31 Maret 2016

Latest modern science | Link roundup for March 2016 - Si Bejo Science

I have to lead with Jeremy Fox on the Dynamic Ecology blog, which tells you a big mistake almost every poster makes:


The post actually said too much text, but you get the point. (And thanks for the plug for the blog, Jeremy! Hat tip to Meghan Duffy and Pat Schloss.)

Steven Heard delves into a topic we�ve discussed on the blog before: should you give a poster or a talk?

I think the poster option is underappreciated. Because talks are seen as the default, and because they�re easier to prepare, it�s easy to slip into preferring talks without thinking carefully about the advantages and disadvantages of each format. There are major advantages to posters � especially the very high quality of one-on-one interactions they can bring � and casually defaulting to �talk� blocks off opportunities.

Steven has conferences on the brain this month, as he also wrote about how he tackles conferences as a introvert:

I like all kinds of people � one or two at a time. No matter how much I enjoy seeing my colleagues and friends, I find large quantities of them exhausting.

Ellen Lupton has a free class on poster design up at Skillshare. You need to register, but that�s all. I did so and enjoyed it a lot. If you take the class, you�re asked to design a movie poster. The student gallery is quite fun. Hat tip to, um, Ellen Lupton.

The trick of posters is to take often complex things and present them in a simple way. Brains have a reputation for being complex, so how can they be represented simply? A nice article in Nature Methods applies design to neural circuits. The figure below shows a principle (show different connections use different arrows or different colours, but not both), and a before and after critique:


Hat tip to Adam Calhoun.

David Robinson offers alternatives to pie charts.

 
It�s a lengthy post that is probably helpful if you are fluent in the R statistics package. (I am not, so can�t judge.) Hat tip to Michael Hoffman.

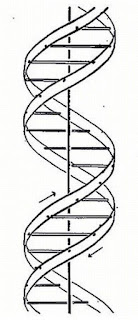
As a biologist, I�ve seen this picture of DNA many times:


What I hadn�t realized until Kindra Crick tweeted it was that this iconic scientific image was drawn by the late Odile Crick, who mostly painted nudes. It was uncredited in the original Watson and Crick paper. Like Jane Richardson (who I mentioned last month), her contribution deserves to be better known. Again, it�s a reminder that good visualizations take some skill that not everyone has, and the impact a good visual can have is enormous.

Here�s how Twitter creates its visual style. Can you articulate a style for your poster as clearly?

Today�s lesson in the importance of typography.


Hat tip to Mark Fidelman and Nancy Duarte.

And now for something completely different: a television series recommendation. While you�ve been watching Netflix original series like Daredevil or House of Cards, this one might have escaped your attention because it�s a foreign language series (Japanese).


Atelier is just a lovely series about beauty, design, craft, professionalism, and mentoring: themes that often appear on this blog. It�s subtle, often funny, and so well observed.


Oh yes, and there�s a lot of lingerie. So it�s a little more visually interesting than academia. Recommended.

(I know, lingerie shows up on this blog more often than one might expect. But it�s not always my fault!)

�Too much stuff� image from here.

Kamis, 24 Maret 2016

Latest modern science | Lessons from Skin Wars: Have a focal point - Si Bejo Science


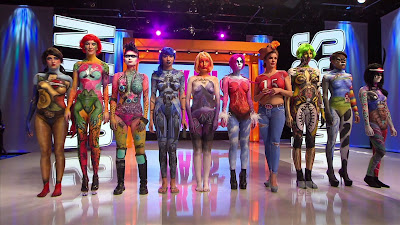
I�ve been catching up with a show called Skin Wars on Hulu (new season coming on Game Show Network in April). It�s a competition reality show along the lines of Project Runway, Top Chef, and FaceOff: make something really cool, really fast. The cool thing they�re making in this case is body painting.

While watching the show, the judges often criticize a painting for not having a focal point. The artists make very intricate paintings, but when you step back, it�s all a confused mess. Nothing stands out.

I often see this with posters. Because posters tend to include way too much text, everything tends to turn into a uniform gray. Graphs tend to look alike.There�s few things that demand attention.

For instance, here�s a painting with no focal point:


Here�s another example of a painting, by Kadinsky, but this time with a clear focal point:


I�m willing to bet the thing that pops out is the dark circle in the upper left.

The reason is that the dark circle stands in contrast to most of the rest of the painting, which is light and has lots of straight lines and angles. Here�s another example of contrast being used to create a focal point:


It�s a contrasting colour, but a contrasting shape would work too. Imagine an unripened banana in the place of the red apple in the picture above. You�d still look more at the banana, because it is different.

Another simple way to create a focal point is with that most underused tool, white space:


There are lots of blue circles on the page, but the one surrounded by lots of white space is emphasized.

A third way to create a focal point is with lines:


Thanks to perspective, the strong lines of the train tracks, the top and bottom of the train cars, and the treetops all converge onto the vanishing point, which becomes the image�s focal point.

To use a focal point in a poster, you first need to decide what the most important thing on your poster than you want to emphasize. Once you have done that, use the three tips above (and many others besides!) to create a clear focal point on your poster.

External links

Dominance: Creating Focal Points In Your Design
Gestalt Principles: How Are Your Designs Perceived?
Designing with strong simple focal points
How to use focal points to enhance your photography
Top 25 mistakes artists make #2: not adding a focal point

Landscape from here; Kadinsky painting from here; apple picture from here; abstract from here.; mountains from here.